Last week I ran a peer comparison between two banks. What I found is the most important thing a peer report will never tell you.
Two banks. Same state. Both right around $650 million in assets. Their return on assets matches to the decimal, 1.19 and 1.19. Credit so clean you could eat off it on both sides. Nonperforming loans near a third of a percent. Charge-offs at zero.
On a peer report, they are the same bank. A board looks at either one, checks the boxes, profitable, clean, right-sized, and turns the page.
One of them is closer to a capital problem than its board knows.
The thing that separates these two banks does not show up in the return. It does not show up in the credit. It does not show up in any single line on the peer report. Not because the report is wrong. Because the risk does not live in any single line. It lives in the space where three of them meet.
Let me put both banks on the table. Three numbers each. Watch what happens when you read them together instead of one at a time.
Concentration. Bank A has lent 427% of its capital into commercial real estate. The supervisory guideline starts asking hard questions at 300%. Bank B sits at 138%. Less than a third of the exposure, well under the line.
Reserve. You would expect the bank carrying three times the concentration to hold the thicker cushion. It holds the thinner one. Bank A reserves 1.00% of loans. Bank B reserves 1.49%. The peer median is about 1.27%. The riskier bank is reserved below its peers. The safer bank is reserved above them.
Margin. Bank A earns the wider margin, 5.09% against 3.66%, and it is not just wider than its twin. It is above the peer median, top of the range. On the peer report, that one line reads as the best-run bank in the room. Read it next to the other two and it reads as something else. The market is paying Bank A more because Bank A is taking more risk. That is a risk premium. Bank A's board is booking it as outperformance.
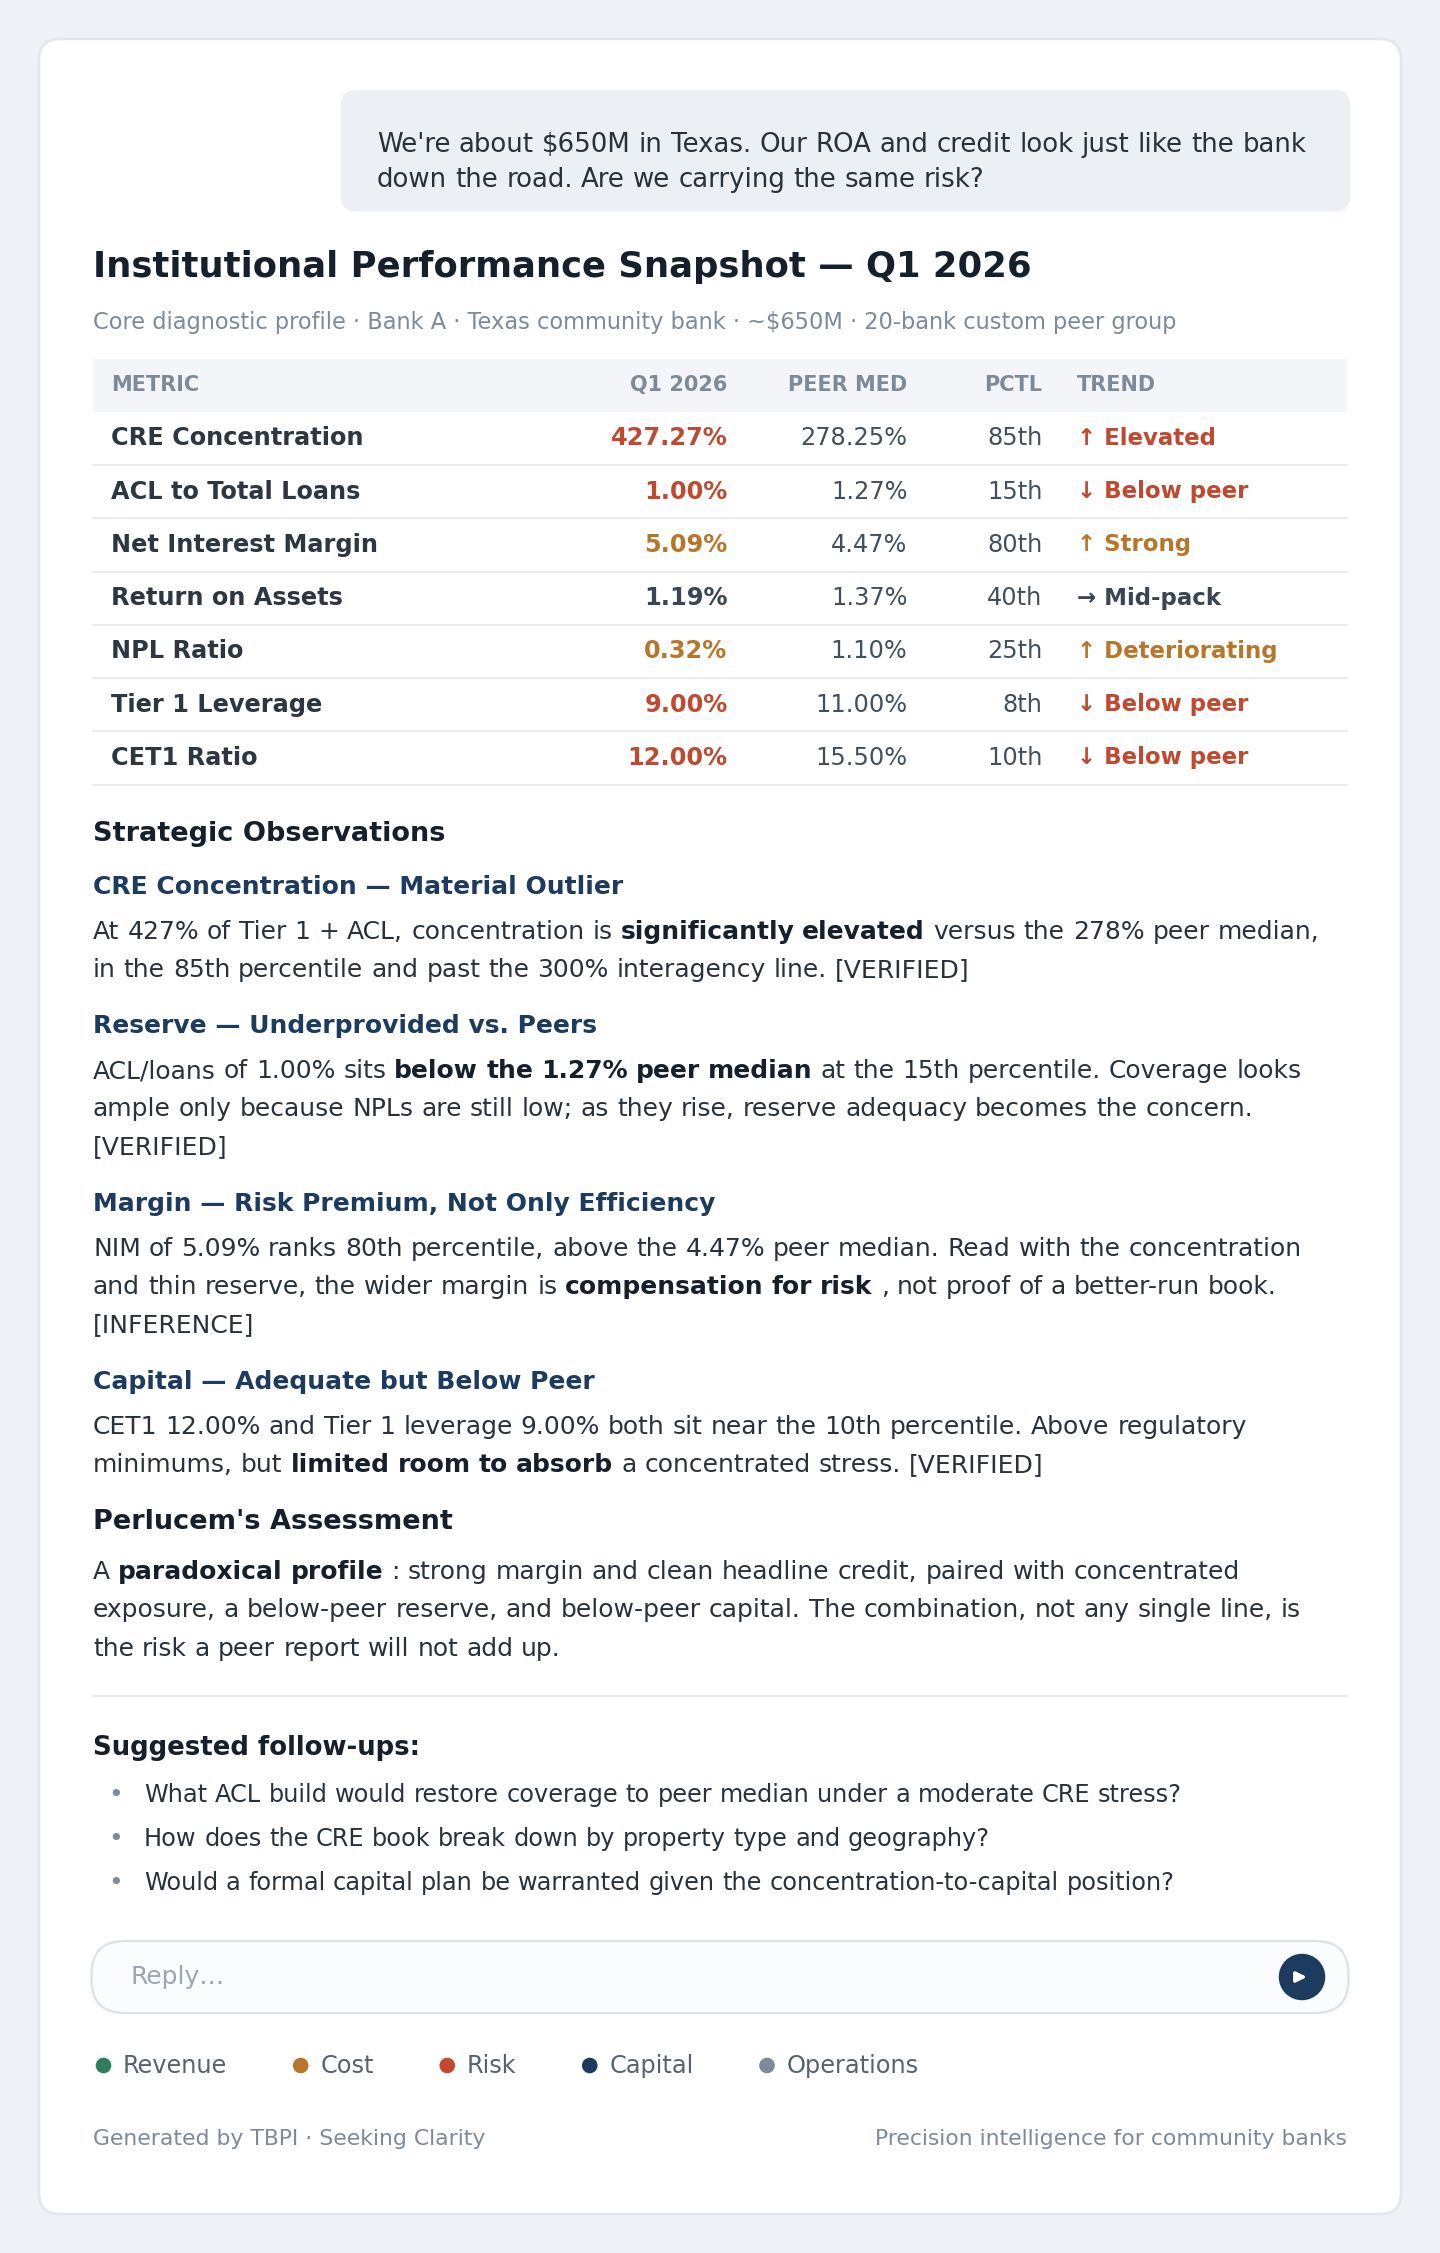
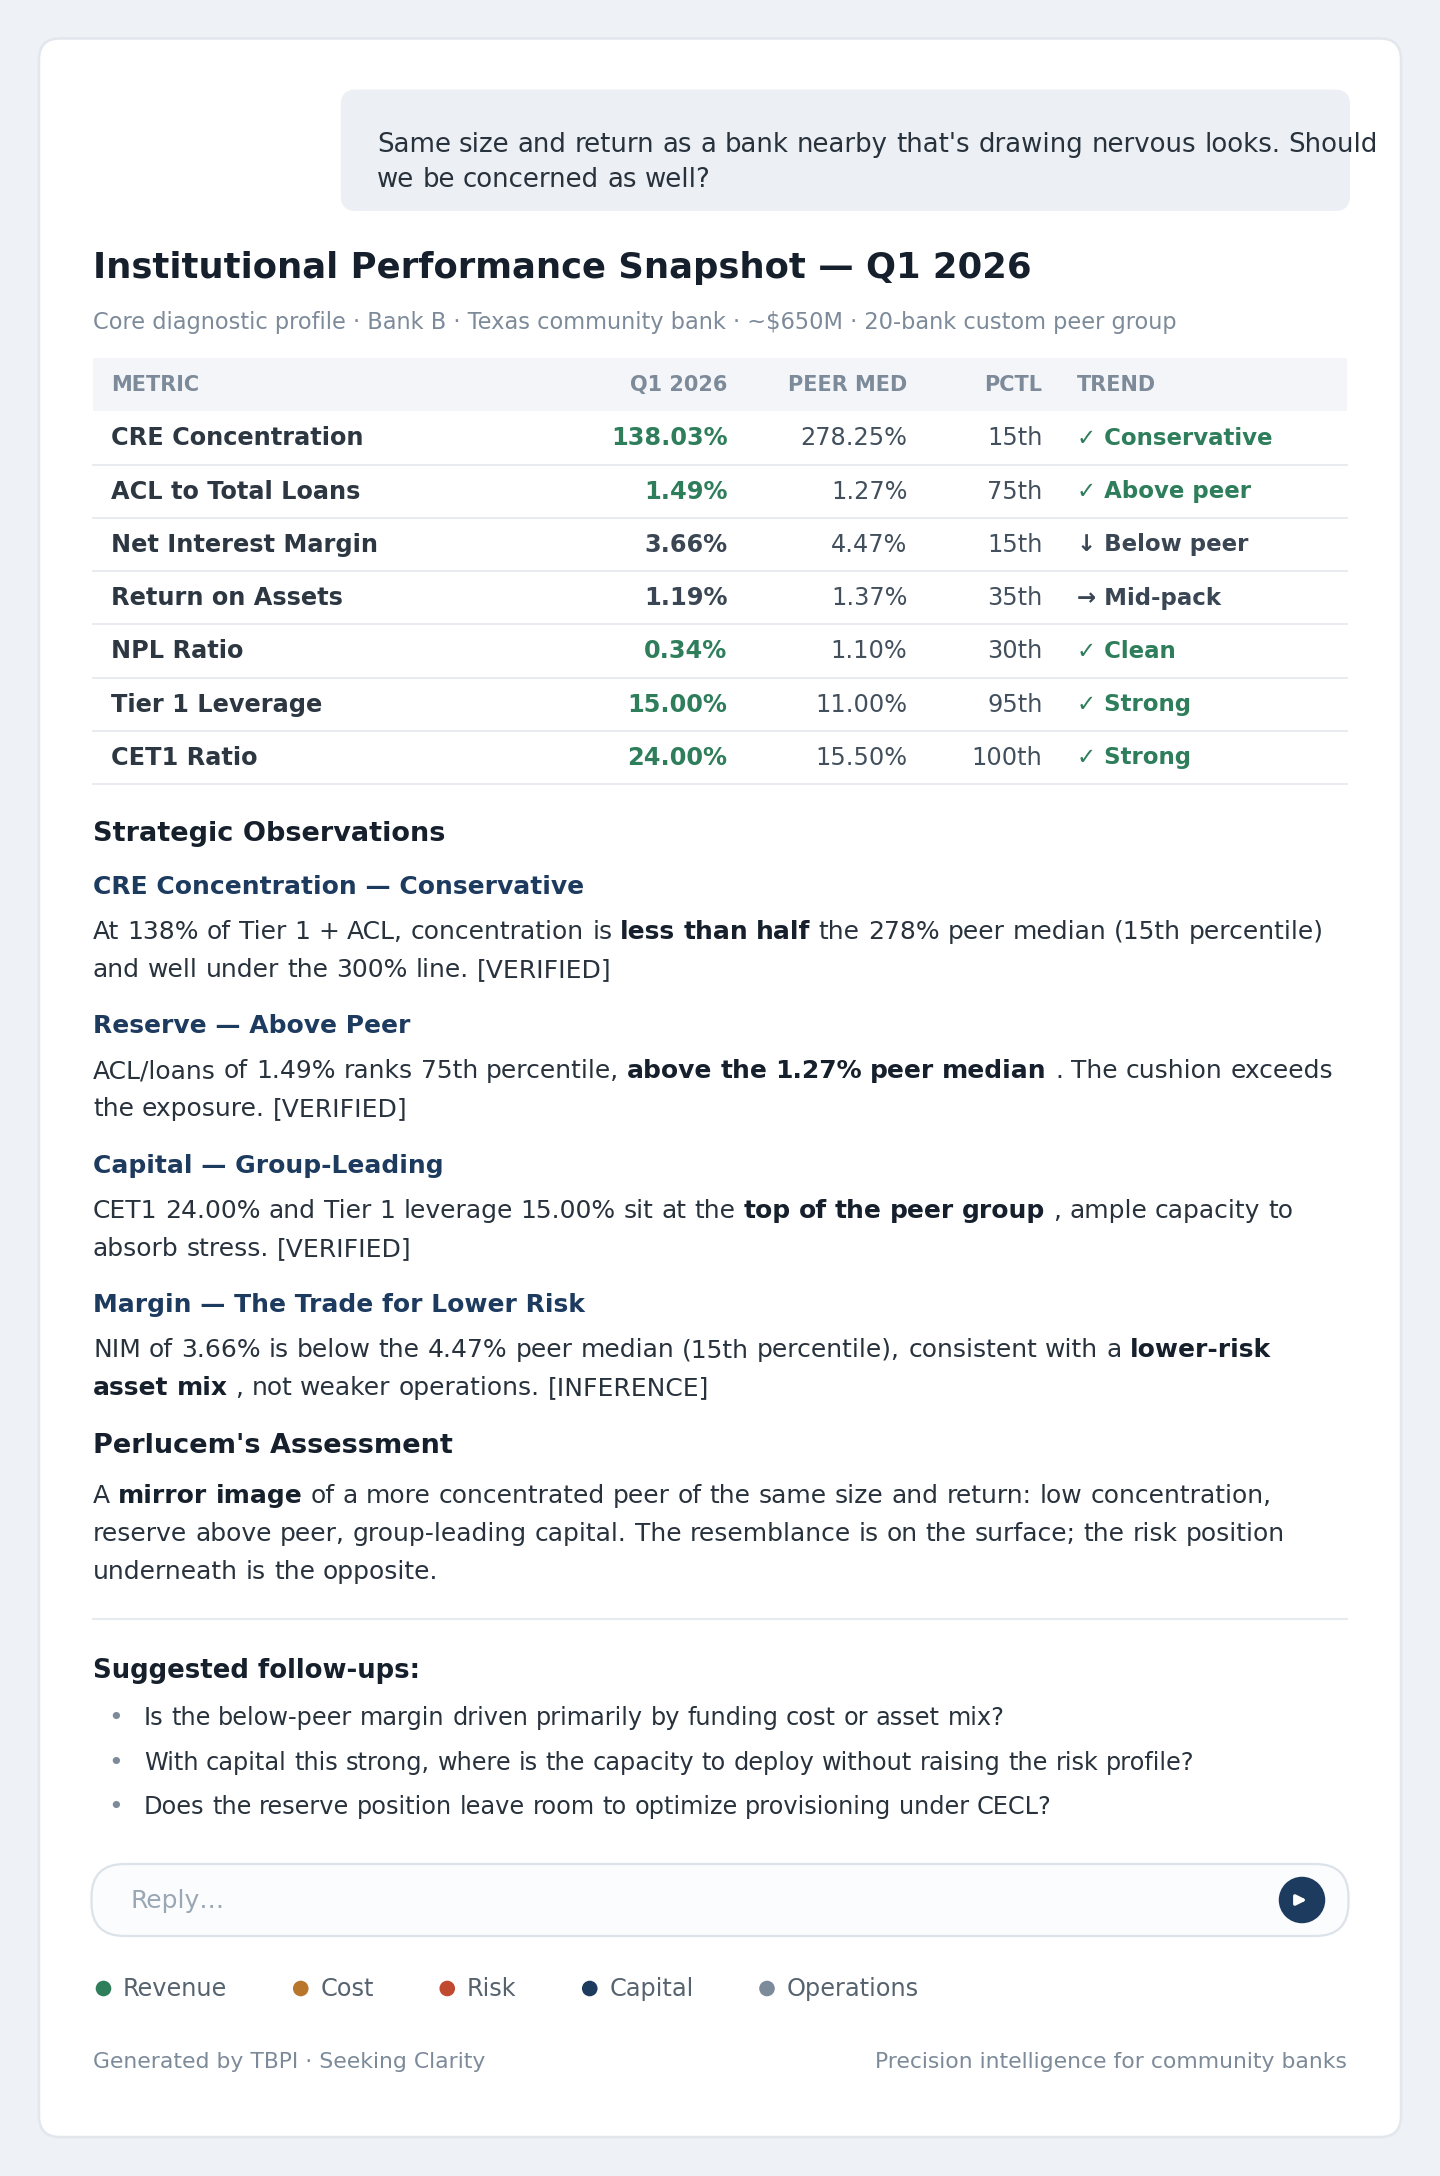
Two Texas banks, both ~$650M. Names withheld. Figures verified via TBPI, Q1 2026.
Take any one of those three lines on its own and Bank A looks fine. A wide margin looks like strength. A 1.00% reserve clears the threshold. Even the concentration, by itself, is a number plenty of healthy banks carry.
The danger is not in any one level. It is in the combination. Heavy concentration, thin reserve, fat margin, all at once, in the same bank. The peer report shows you those three numbers on three different pages. It never multiplies them together. That multiplication is the whole story.
This is the difference between a complicated problem and a complex one. A complicated problem is one hard number you have to find. A complex one is three easy numbers that mean nothing apart and everything together.
You can run this on your own bank tonight. Three questions.
- Where is my CRE concentration against the 300% line, and against my peers?
- Is my reserve keeping pace with that concentration, or falling behind my peer group?
- Is my margin advantage real efficiency, or am I being paid for a risk I have not named?
If the honest answers are high, behind, and paid for risk, you are Bank A. And the peer report will keep telling you that you are fine, right up until the examiner tells you that you are not.
Bank A's nonperforming loans just quadrupled in a single quarter. Not to a frightening number. They went from almost nothing to a third of a percent, still below the peer median. On the peer report it does not even register.
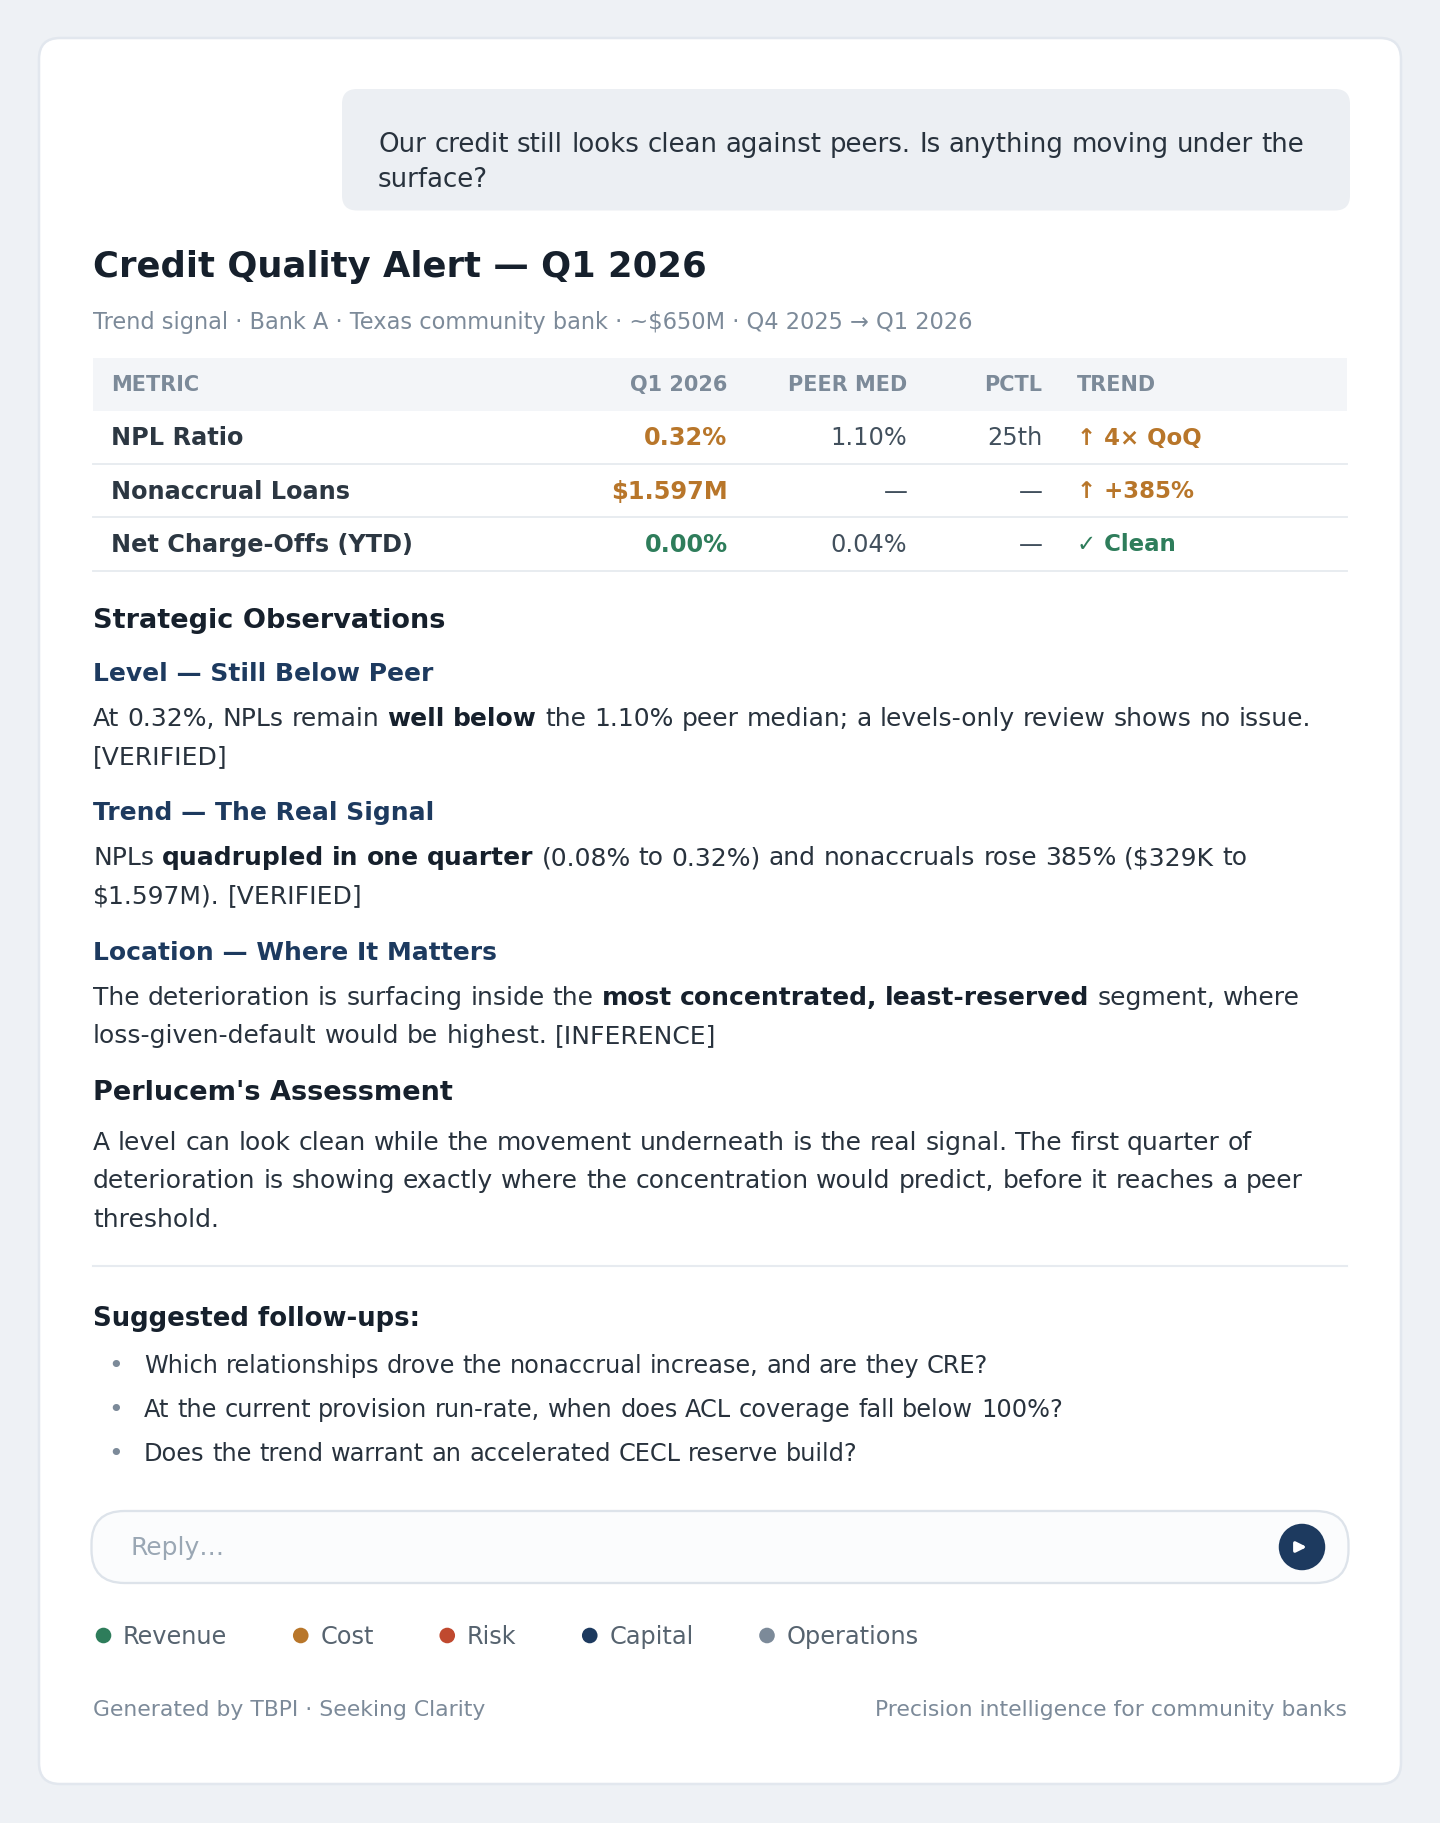
But it is the first crack, and it is showing up exactly where you would expect it, inside the most concentrated, least reserved book of the two. A board that reads only levels sees a clean credit line. A board that reads movement sees the floor starting to give.
The examiner is going to do this math. So is the next downturn. The only question that matters is whether you do it first, while you still have time to fix it instead of explain it.
That is the whole job of a board. Not to read the numbers. Anyone can read the numbers. To read the space between them.
This is exactly what we built PerLucem to do. We read the space between the numbers, on your bank, the way an examiner will, before an examiner does. If you want to see your own three numbers put on the table together, book a 30-minute look and we will walk your bank through it.